Track Clicks with IPLogger
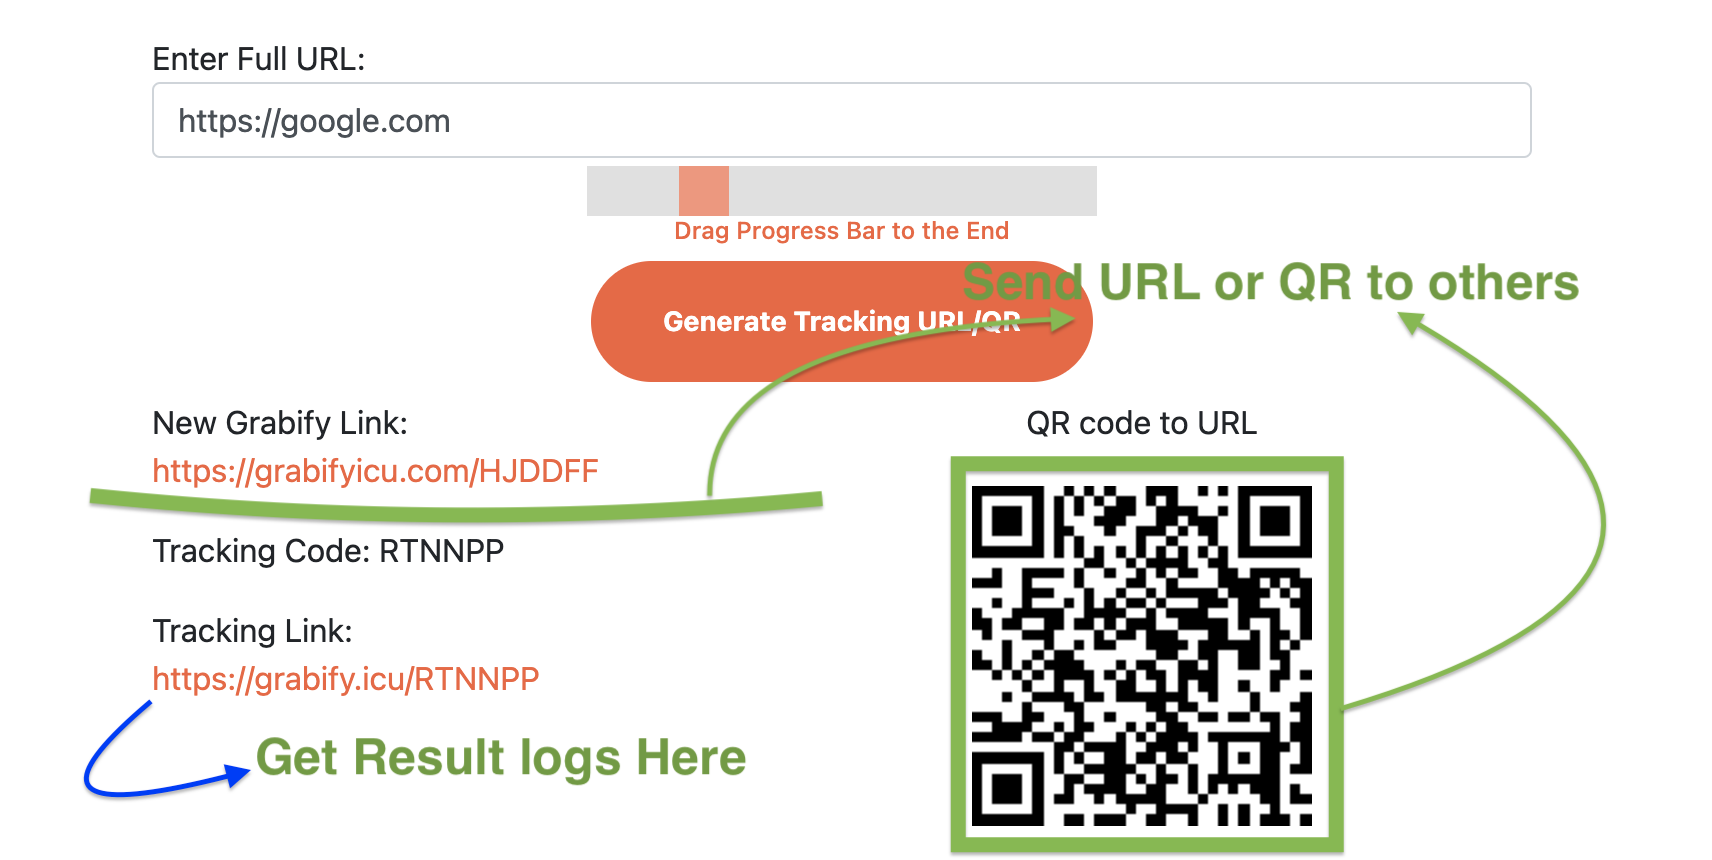
Create tracking links to see who clicks them. Get IP addresses, location info, and device details. Use it for analytics, security, or just to know who's checking out your links.
Your Tracking Information
QR Code
Scan to access your IPLogger Link
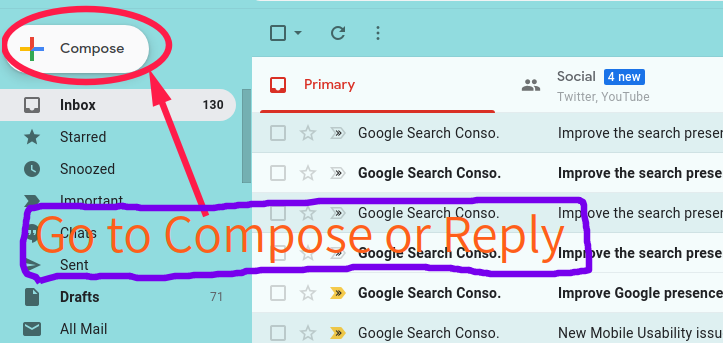
Email Open Tracker
Create invisible tracking images to know when your emails are opened. Generate tracking pixels that capture recipient data including IP address, location, and device information when emails are viewed.
Your Email Tracking Information
Tracking Pixel Preview
Copy this tiny invisible image into your emails
How Email Tracking Works
When you add this tiny image to your email, it loads from our server whenever the email is opened. This lets you know exactly when someone views your message and provides information about their device and location.
IP Address Checker
Want to look up information about a specific IP address? Use our free IP checker tool to find location details and network information about any public IP address.